30 November 2010
Holcim: sold today

25 November 2010
u-blox: sold remaining shares today
I sold the remaining shares of u-blox (SWX:UBXN) today at CHF 49.20
Watching Meyer Burger


Meyer Burger (SWX:MBTN) may be getting interesting in a day or two. Both MACD and Stochastics could give a buy signal.
24 November 2010
Gold ETF: bought today
I bought the Gold ETF of the Zurich Cantonal Bank (SWX:ZGLD) today at the open at CHF 4,325.43
23 November 2010
Bad news for Sonova

Holcim not going the way I expected
 Holcim did close the gap yesterday, after all, three hours after the open. This should teach me not to be too rash in buying a stock. I should have paid attention also to MACD.
22 November 2010
Holcim: bought today

20 November 2010
Limit order to buy Holcim
 Just gave an order to buy Holcim (SWX:HOLN) with a limit of CHF 66.75, which was yesterdays close.
The price might fall again to CHF 66.00, but I am speculating on it going up.
19 November 2010
Sonova: sold all today

I shall keep watching SOON, looking for the next opportunity to buy.
18 November 2010
Holcim forming a pennant?
 Now that the market has closed for today I want to have a closer look at what seems like the formation of a pennant, also known as bear flag, on the chart of Holcim (SWX:HOLN). This is what Investopedia says about it:
"The pennant is identified by two converging trendlines, more horizontal, which resembles a symmetrical triangle. It is characterised by diminishing volume."
A third criterion is mentioned by stockcharts.com:
"Even though flags and pennants are common formations, identification guidlines should not be taken lightly. It is important that flags and pennants are preceded by a sharp advance or decline. Without a sharp move, the reliability of the formation becomes questionable and trading could carry added risk. Look for volume confirmation on the initial move, consolidation and resumption to augment the robustness of pattern identification."
I see that the development over the past few days meets all three criteria so far. If the price range remains within the two converging lines Friday and Monday and the volume remains low, this should be confirmation of a pennant.
Flags and pennants

Looking at Holcim
 Scouting for new buy candidates, I am looking at Holcim (SWX: HOLN). A news report published yesterday, only in German, says that Morgan Stanley has reduced the price target from 62.50 to 59.50, yet today the price is going up. Is this a reflection of how little the market thinks of the analysis made by Morgan Stanley.
At any rate, I am going to keep watching HOLN and see if it breaks out of the channel I have drawn on the chart.
Sonovan: sold half today
17 November 2010
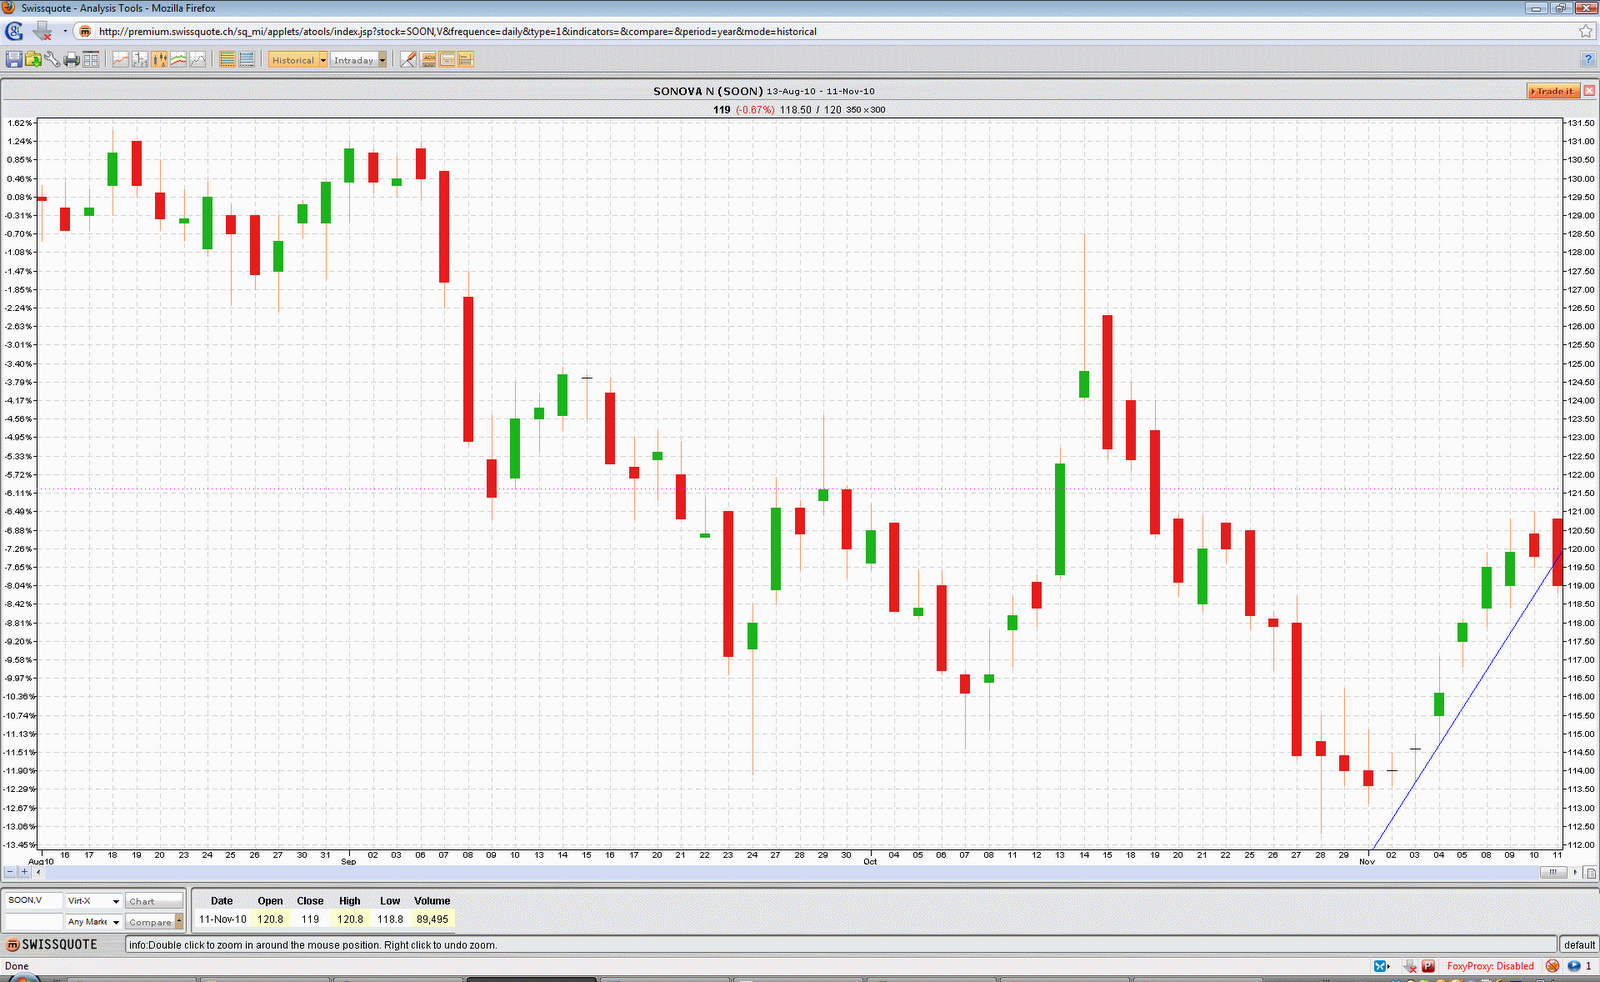
Where is Sonova going from here?
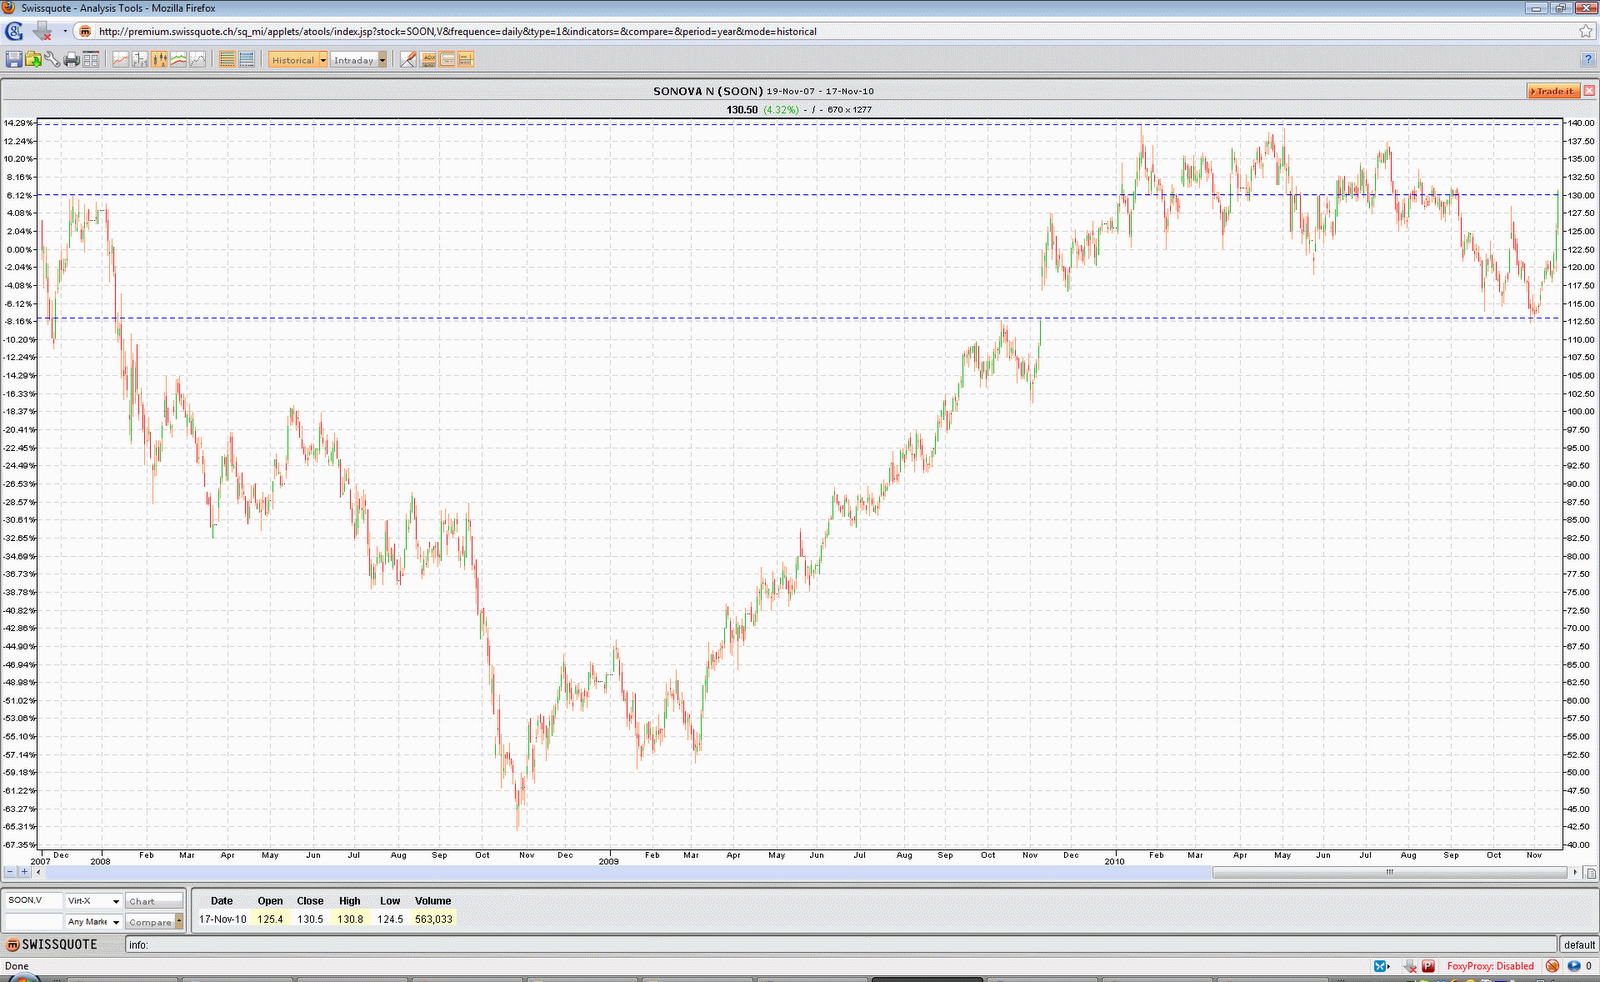
I am trying to make some sense of the price chart of Sonova (SWX:SOON).
Today, it closed above the high of 129.80 immediately before the crash in December 2007. That decline ended in October 2008 with a low of 42.00
On 10 November 2009, the price gapped upward 3.4%, with a low of 116.80 on that day compared with a high of 113.00 on the previous day. Not until 28 October 2010, 20 days ago, was this gap closed with a low of 112.30 and since then the price has been on an upward trend, with just a small two-day dip along the way.
The latest all-time high, 139.80, was on 20 January 2010 and the price has been see-sawing since then, coming close to testing that high on 4 May with 139.60 and on 19 July with 136.60
 What can we expect now? A continued up and down until at some point the high of 139.80 gets tested?
I searched for news to explain the increase of 7,1% over the last two days. There was the report of the 17% increase in sales during the first half of the current fiscal year, ie April–September 2010, but I understand this was what analysts had expected. Had it been a surprise, surely the price would have jumped all at once, creating a gap, but as it is it has risen steadily, hour by hour.
Lucky by mistake with Sonova
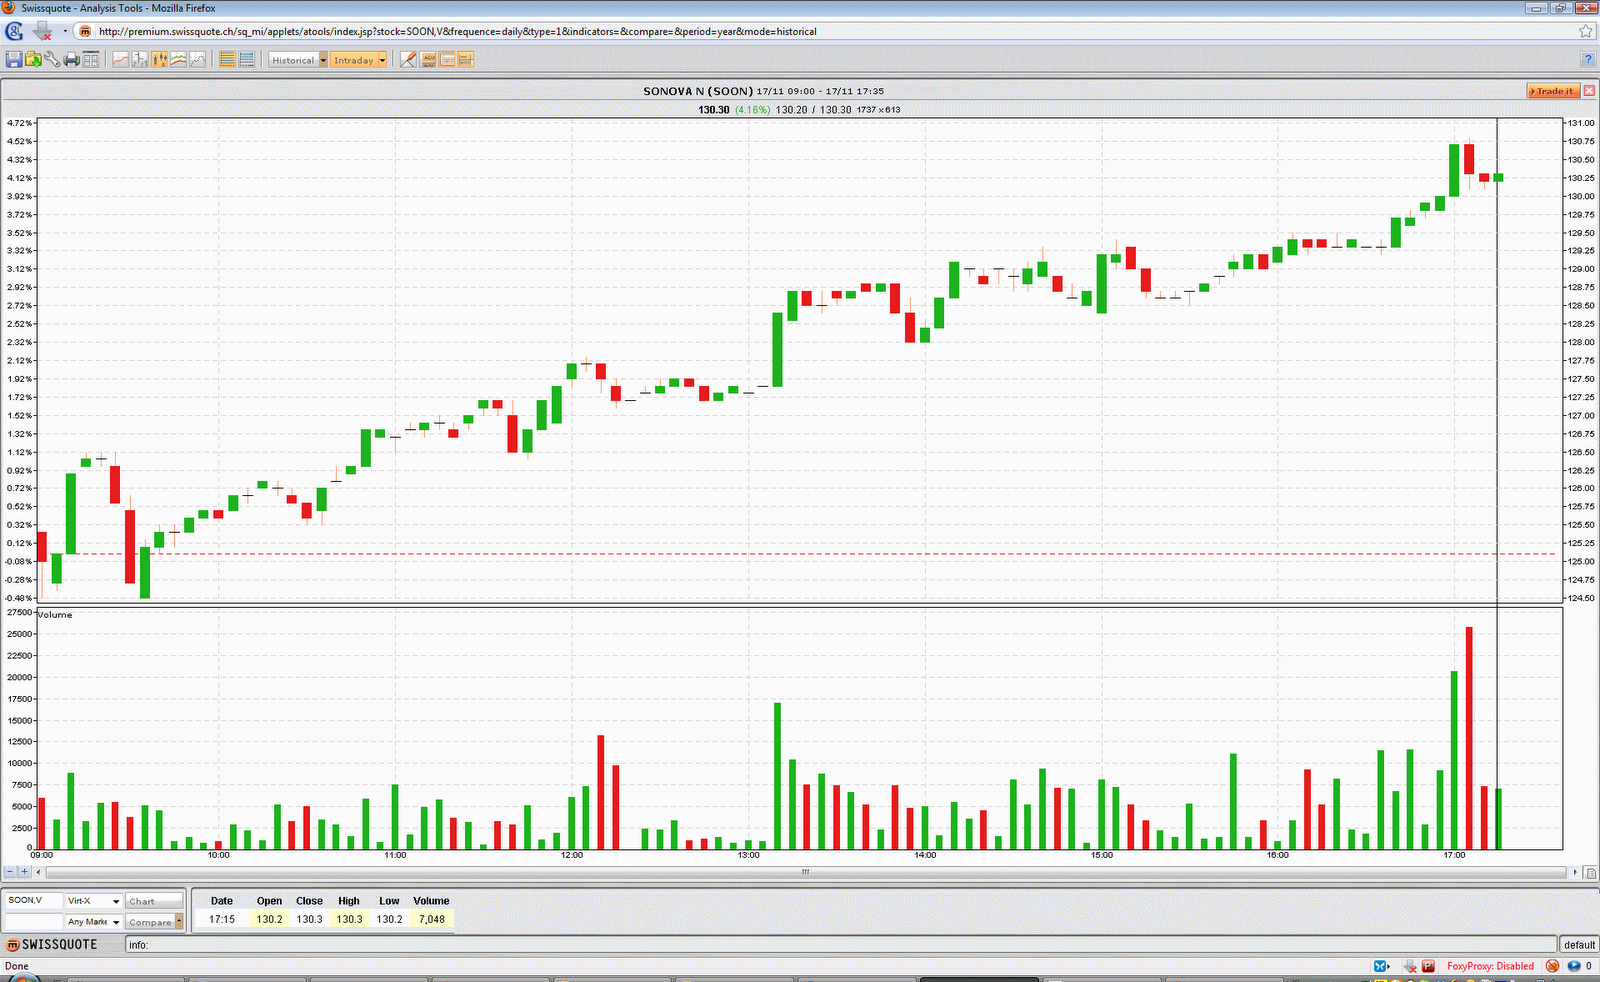 I am holding too much Sonava (SOON) and meant to sell half of it today shortly after the open at CHF 126.00 but I must have forgotten to do the final mouse click and nothing got sold. In the meantime the price rose even higher and the stock is trading at CHF 130.30 at the moment.
ETFS Brent Oil: sold half today
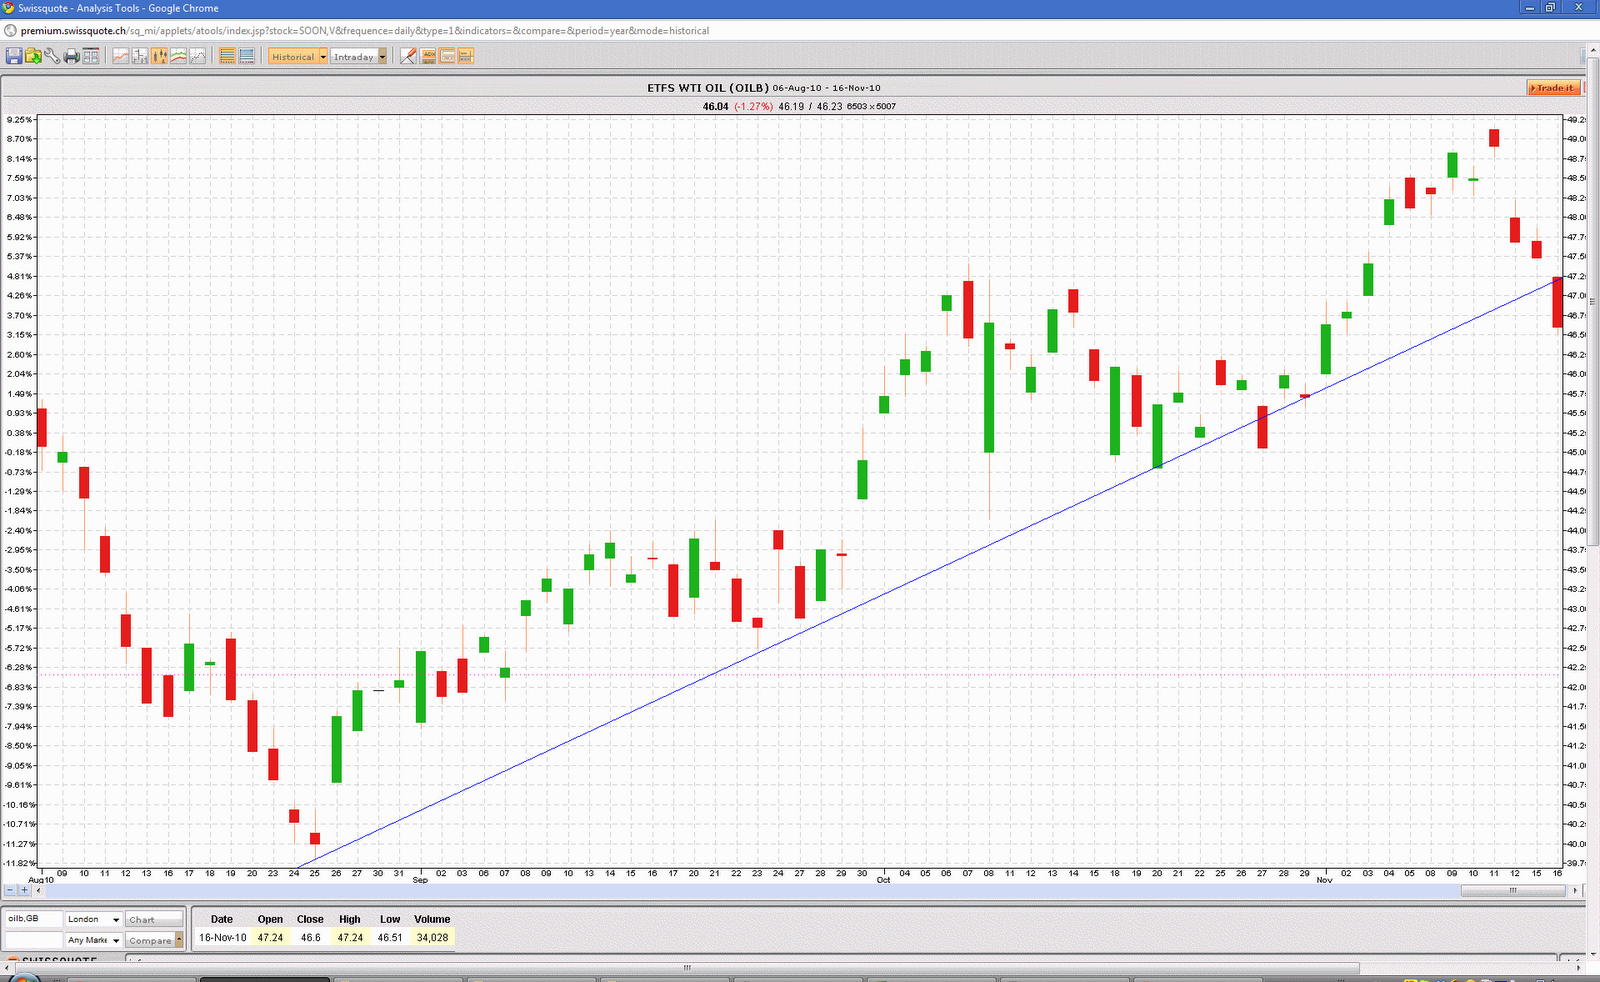 ETFS Brent Oil (LSE:OILB) also gave me a sell signal yesterday and when I saw it open today below yesterday's close I sold half of my position at USD 45.96. My cost having been USD 43.82, this represents a profit of 4.9% in 152 days. Taking into account the drop in the value of the dollar, I made a loss of 8.7% in CHF, the currency in which I traded this ETF because I do not have a USD account with this Swiss broker.
ZKB Gold ETF: sold today
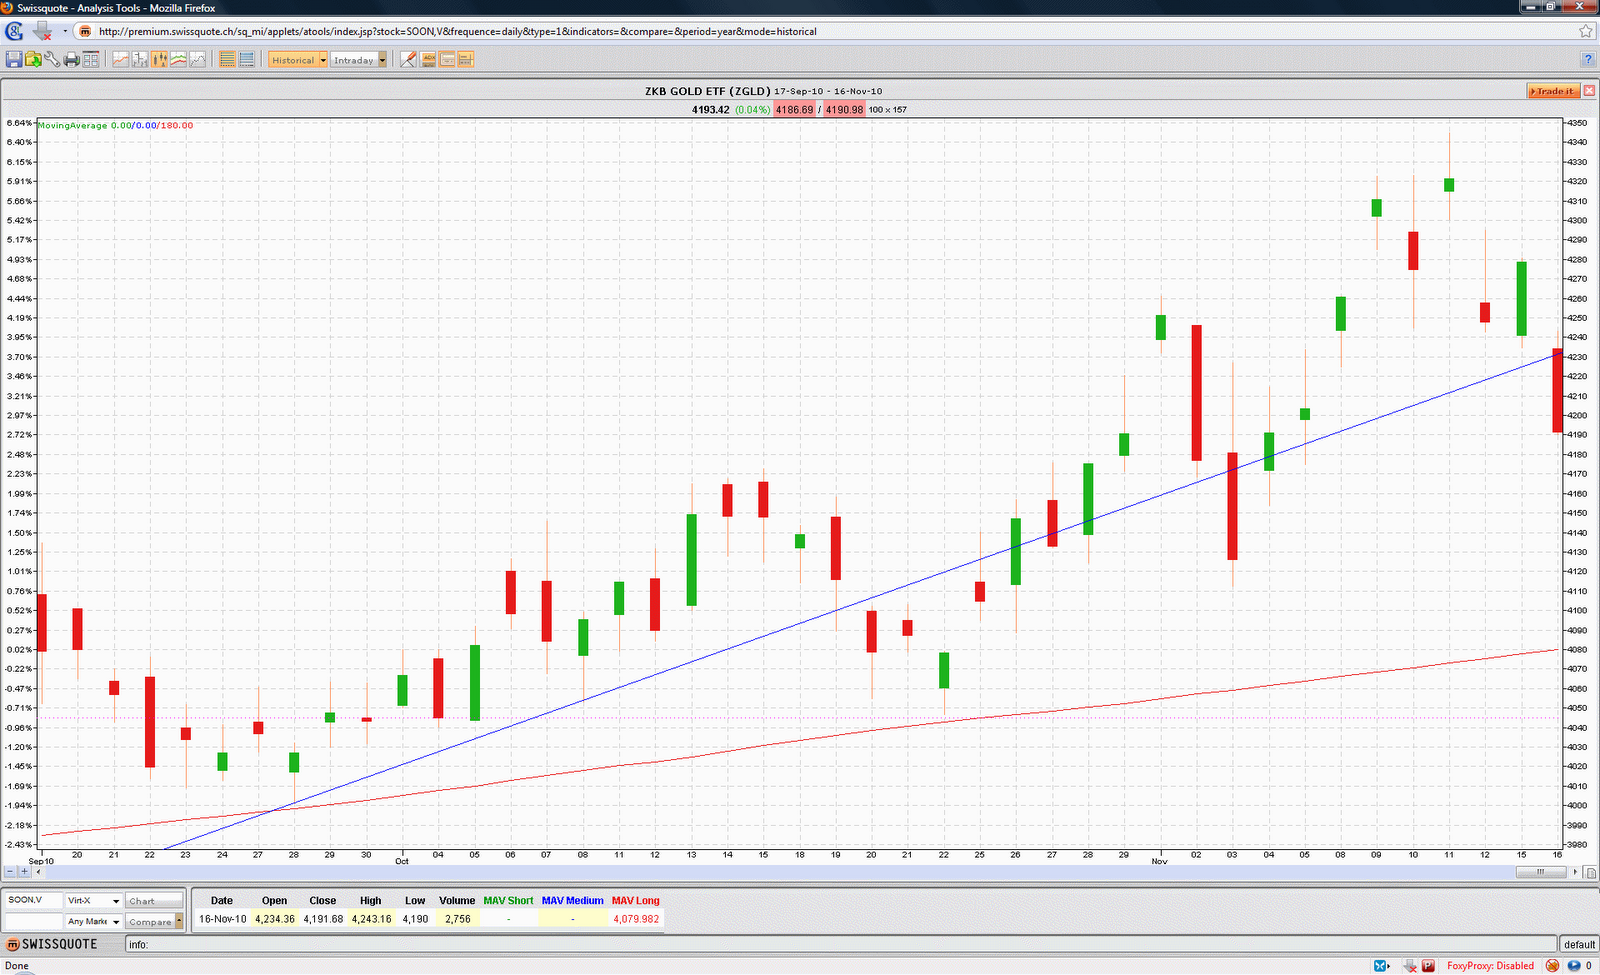 Gold has had a bumpy ride since I first bought a ZKB Gold ETF (SWX:ZGLD) in May at CHF 4,045. Seeing yesterday's sell signal, I sold it minutes after the opening today at CHF 4,187, resulting in a profit of 3.5% in 198 days.
11 November 2010
Holding on to Sonova
 Sonova (SWX:SOON) closed at CHF 119.00, below my trendline and it does not look good. Throughout the day, the price never rose above the opening price. Nevertheless, I have decided to hold on to it for the long term.
Worried about Sonova

Watching gold
 After trading above USD 1,400 for the first time three days ago, the gold price has dancing around that line for the past 38 hours in a horizontal channel. Will it break out on the upside today?
05 November 2010
Sonova: bought some more today
 The price of Sonova (SWX:Soon) did not go the way I had expected after I bought it at the end of September 2009 at CHF 121.60. There was a new buy signal two days ago, which I did not quite trust, but I now added to my position today at CHF 116.10, bringing my average cost CHF 119.60
Subscribe to:
Posts (Atom)