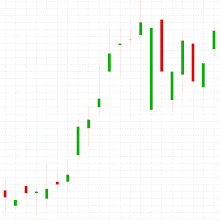
I am trying to make some sense of the price chart of Sonova (SWX:SOON).
Today, it closed above the high of 129.80 immediately before the crash in December 2007. That decline ended in October 2008 with a low of 42.00
On 10 November 2009, the price gapped upward 3.4%, with a low of 116.80 on that day compared with a high of 113.00 on the previous day. Not until 28 October 2010, 20 days ago, was this gap closed with a low of 112.30 and since then the price has been on an upward trend, with just a small two-day dip along the way.
The latest all-time high, 139.80, was on 20 January 2010 and the price has been see-sawing since then, coming close to testing that high on 4 May with 139.60 and on 19 July with 136.60
I searched for news to explain the increase of 7,1% over the last two days. There was the report of the 17% increase in sales during the first half of the current fiscal year, ie April–September 2010, but I understand this was what analysts had expected. Had it been a surprise, surely the price would have jumped all at once, creating a gap, but as it is it has risen steadily, hour by hour.


No comments:
Post a Comment